Simple ping HTTP server. Part 2: A better observability.
TLDR: Created a dashboard to see the requests to the server, check it out here: Grafana dashboard
If you haven’t seen the first part I recommend you watch it: Part 1: The basis
One of the things to improve is the observability of the app, writing a “.” in a file when a request arrives is disastrous. So to improve that, Grafana comes to the rescue!
Before starting talking about implementacion of the new way of observability check how simple the actual panorama is: Someone makes a call to https://health.santiagorincon.dev/ping and the request directly enters in the go app like this:

How use and implement a real observability tool?
First of all, what tool can be used?, there are multiple options like Grafana or kibana, in this case Grafana will be the election because it can receive data from multiple datasource (this can be helpful in future posts)
Sooo. What is Grafana?
What is Grafana?
In a super super simple way, think of Grafana about as a front-end that can show fancy graphs, there graphs are built using the data stored in some database, this storage are known as data source and Grafana is compatible with multiples various.
That means that the golang app can’t sent directly metrics to Grafana, because the flow must be:
Go APP -> Datastore -> Grafana
But there is a catch, Grafana can be used deploying our own instance or a cloud instance. For now, the cloud option will be used because the storage there is more consistent (is easy make a mistake in the server and delete all the metrics generated!)
With that clear, remains one question, what datastore are going to be used? In this case prometheus will be used, a timeseries database that can be easily deployed and integrated with Grafana
What is prometheus?
In a super simple way, think of prometheus as a place where events with a ocurrence date are saved. As many databases, you can do queries over the data (really is tool to made multiple types of monitoring, but for now think in prometheus as a database)
Prometheus has a special thing about its way of working and is the app don’t send metrics to prometheus, prometheus is who query the app to get metrics
What we going to do?
Grafana, Prometheus, and a Golang app. How does this fit together?. All of this is to create a dashboard that shows the requests made to the ping server, which works as follows:
- Golang APP generate the desired metric (every time a GET is done, a count metric is updated)
- Prometheus make snapshots of the current metric given by the APP (every second)
- Prometheus exports the data to the prometheus datastore in Grafana (local db make a replica in Grafana db)
- In Grafana a dashboard is created running a query into the prometheus datastore to show the data
A diagram of what is going to be done can be see like this:

Implementing
In general, the concepts should be clear now. If not, I hope they will become clearer below.
The steps will be:
- Create the desired metric in the API
- Create Grafana instance and run prometheus datastore
- Create local prometheus DB and replicate to Grafana
Creating metric in API
Because prometheus scrape metrics from the API, it is necessary to expose a new service in order to allow prometheus to get data and modify the ping handler to create the metric. Luckily prometheus have a SDK to make that simple.
First, create the service that prometheus will consume, to do that use:
s.Handle("/metrics", promhttp.Handler())
(/metrics is the default name used by prometheus but can be anything)
It only remains to create the metric, to do that is important to understand that prometheus manage 4 types of metrics: counter, gauge, histogram and summary. In this case the metric of type counter will be used because we want to graph when a request is done and to do that, it is necessary have a counter of hoy many requests has been done to the API, you can check the docs here to see the details of the other metrics. Sooo, to do that it is necessary to create a counter that will be used by the handler like this:
counter := promauto.NewCounter(prometheus.CounterOpts{
  Name: "simple_ping_request_done",
})

s.HandleFunc("/ping", func(w http.ResponseWriter, r *http.Request) {
  counter.Inc()
  w.Write([]byte("pong"))
})
Also, the metrics can be labeled, and that is usefull to diferenciate beetwen local and the prod, to do that we going to use a environment varible, as in the past was the variable “PORT”, to set the enviroment we going to use “SCOPE”, that will work as:
scope := "local"
if customScope := os.Getenv("SCOPE"); customScope != "" {
  scope = customScope
}

counter := promauto.NewCounter(prometheus.CounterOpts{
  Name: "simple_ping_request_done",
  ConstLabels: map[string]string{
    "scope": scope,
  },
})
If no variable is set, means that the app is running in local.
At this point you can see the code here: part-2/expose-prometheus-service-in-api
(i know, the code is ugly, in a next post centered in software design will be fixed, for now call it technical debt :p )
With that we finished the part of the app, you can git checkout part-2/expose-prometheus-service-in-api and run the app locally. If you go to the new exposed service (https://127.0.0.1:1443/metrics) you will get a bunch of text, if you detail it, every line without comment is a metric! (by default the SDK of prometheus expose metrics of golang), and if you try to find our metric “simple_ping_request_done” will be there!. Now make a ping with https://127.0.0.1:1443/ping, check again and now the value of the metric change from 0 to 1!.
Create local prometheus DB
To achieve that, Docker comes to the rescue by providing a ready-to-use Prometheus image. To run the DB create a docker-compose.yml file that have this info:
services:
  prometheus:
    image: prom/prometheus
    volumes:
      - "./prometheus/:/etc/prometheus/"
    ports:
      - "127.0.0.1:9090:9090"
    restart: always
That means that we going to create a container to the image “prom/prometheus” (the image have the code to run the DB). The ‘./prometheus’ folder of our project will be used as ‘/etc/prometheus’ in the container. (this is important because there will be the configuration of the DB). After that we expose the port 9090 (there is located a UI that allow us to do queries) and finally a policy of reset is set (if the database is down, docker will try to relaunch immediately)
Before run it, there is one thing left to do, the configuration!. Remember the part of the “volume”?. Create a folder called “prometheus” and there create a file “prometheus.yml” that have this content:
global:
  scrape_interval: 1s
scrape_configs:
 - job_name: simple-ping-app
   scheme: https
   tls_config:
    insecure_skip_verify: true
   static_configs:
    - targets:
       - 127.0.0.1:1443
With that we are telling to the prometheus server:
- The queries executed to get snapshots of the metrics will be done every 1 second
- One of the places of scrape data will be called “simple-ping-app”
- This “simple-ping-app” will be queried over https and ignoring the validation of certificates (remember that in local we create our own certificates that aren’t valid to the world)
- The location of “simple-ping-app” is in 127.0.0.1:1443
- By default the endpoint that will be used is “/metrics”
Now to test it, run the api as always with go run main.go and check the endpoint of metrics is working with https://127.0.0.1:1443/metrics
After that run the docker container with:
docker compose up
(remember have docker and docker engine installed, otherwise you can install from here: https://www.docker.com/get-started/)
Now if you go to https://127.0.0.1:9090 you must see an UI where execute querys. That for now isn’t important, first check that prometheus is getting data from the app, to do that in the UI of prometheus go to Status > Target Health.
At this point you can see the code here: part-2/docker-compose-for-prometheus and config
Sadly you will see the API down with an error that says: Error scraping target: Get "https://127.0.0.1:1443/metrics": dial tcp 127.0.0.1:1443: connect: connection refused
Why happens that? Because the app is running in our machine and the prometheus server is running in a container, the container can’t access to the services of our machine because is isolated.
To solve that, there are two options:
- Run the go app inside a container that can comunicate with the other container of prometheus
- Do some (non-standard) configurations in the actual container to allow comunication between the prometheus container and our machine
The first is more elegant, will help us in the future and give a easy way to get up infrastructure to test things. And also will make much easy deploy in prod (remember the crontab and running the app as user root in part 1?, this things dissapear with docker)
How dockerize an application?
To run the Go app as we did with Prometheus, it’s necessary to create an image, in case of prometheus wasn’t necesary because someone already created it and host for us (if you are curious, the image of prometheus is hosted here).
Nobody is making the favour of create an image of this project; So we need to create it. To do that is fundamental having a file called “Dockerfile”. There will be saved all the instructions to create the image and will look as this:
FROM golang:latest as build

WORKDIR /build

COPY . .
RUN go mod download
RUN CGO_ENABLED=0 go build -o main main.go


FROM alpine

# Copy the application executable from the build image
COPY --from=build /build/main /

ENTRYPOINT ["/main"]
That means that we start creating the image with a first stage called “build”, this first stage will use the go image (in other words a container that already have all the necessary tools to build a go application), next we enter in the /build folder (think in “WORKSPACE” as a “cd” in the terminal), all the project is copied into the container, dependencies are downloaded and finally a binary file is builded (CGO_ENABLED=0 is to create the binary file without any dependencies); At this point the stage “build” is finished.
Only left the last stage that consist in using the alpine image (alpine = a working linux distribution with have a extra low size). In this container the “main” file leaved in the build stage is copied to the final stage and finally we configure that when the container start must execute the binary file “main”.
We have the instructions to build the image, how create the image with this instructions?
Lets use the YML that we already have and append:
  go-app:
    container_name: simple-ping-container
    image: simple-ping
    build:
      context: ./
      dockerfile: dockerfile
With that when ´docker compose up´ is executed docker will try to find an image called “simple-ping” and if not exists will build one using the instructions of ./dockerfile.
But remember that docker compose not only build images, compose also run the images in containers and if you try to run this image a error appears because none of the environments variables used in the app are loaded!. How solve that? adding:
environment:
  - PORT=1443
  - CERT_FILE_LOCATION=/server.crt
  - KEY_FILE_LOCATION=/server.key
But… where is the location of the cert and key if the container can’t access to our machine?. Is possible do the same trick done with prometheus, a volume!, add:
volumes:
    - "./server.crt:/server.crt"
    - "./server.key:/server.key"
With that the environment variables make sense. In the container will be under the root path “/” but in really are saved in the route of the project.
A final adjustment is needed and is exposing the API to our machine (remember that the containers are by default isolated), add:
ports:
  - "127.0.0.1:1443:1443"
With that we can access to the API!
At this point you can see the code with git checkout part-2/dockerize-golang-app, anyways here is the dockerfile and the docker-compose
Now run
docker compose down
docker compose up --build
(down stop and delete the containers, with that is possible a fresh start, and --build force the creation of the image regardless of whether it already exists)
If you do curl -k https://127.0.0.1:1443/ping works (API is OK)! now, enter in 127.0.0.1:9090, also works (prometheus is OK)!
Check the target health in prometheus (Status > Target Health). The same error keep appearing Error scraping target: Get "https://127.0.0.1:1443/metrics": dial tcp 127.0.0.1:1443: connect: connection refused. Why?
We have two containers and in the config of prometeus the API is defined as “127.0.0.1:1443” that means the container try to call itself in the port 1443 but nothing is running there in the container of prometheus!. Must be called the other container of the golang app, and that can be done changing
static_configs:
    - targets:
       - 127.0.0.1:1443
To
static_configs:
    - targets:
       - simple-ping-container:1443
Now run
docker compose down
docker compose up
Enter in the section of target health an now you must be see an “OK” in green! (this time the –build is removed because the code isn’t change, so is unnecesary create another image).
Now we can query. Run a curl -k https://127.0.0.1:1443/ping to generate a metric and after that run the query “simple_ping_request_done” in the UI of prometheus, click execute and boila, the first metric appears.
Now, only remains replicate the data to Grafana and create the dashboard
The new docker-compose can be found here: part-2/connect-to-other-container-by-its-name
Creating Grafana and prometheus instance
To create the Grafana instance create an account in Grafana signup. In the left menu click “+ Add Stack”, a modal appear, click in “Add stack”, wait and close the modal.
Now, click in the “Lauch” of “Grafana”, wait and you will see an empty Grafana instance.
The dashboard will be created there, but first it is necessary to create the database, return to the control panel of Grafana and in the block of prometheus click in “Send Metrics”
There Grafana give you a “Remote Write Endpoint”, a “Username / Instance ID” and finally a “Password / API Token” (click in generate now, and copy the token somewhere)
(also if you go down you will see that replication of local DB to Grafana DB isn’t the only way of make metrics available in Grafana!).
Now you have the necessary credentials, you just need to append in the configuration of Prometheus this part:
remote_write:
  - url:
    basic_auth:
      username_file: ./username_grafana.key
      password_file: ./password_grafana.key
With means: replicate info to the url of Grafana using the user and password saved in the files “username_grafana.key” and “password_grafana.key”
Thats all, only left create the dashboard!
At this point the code can de found there: part-2/replicate-db-to-grafana
Create the Grafana dashboard
Enter in the Grafana instance recently created!
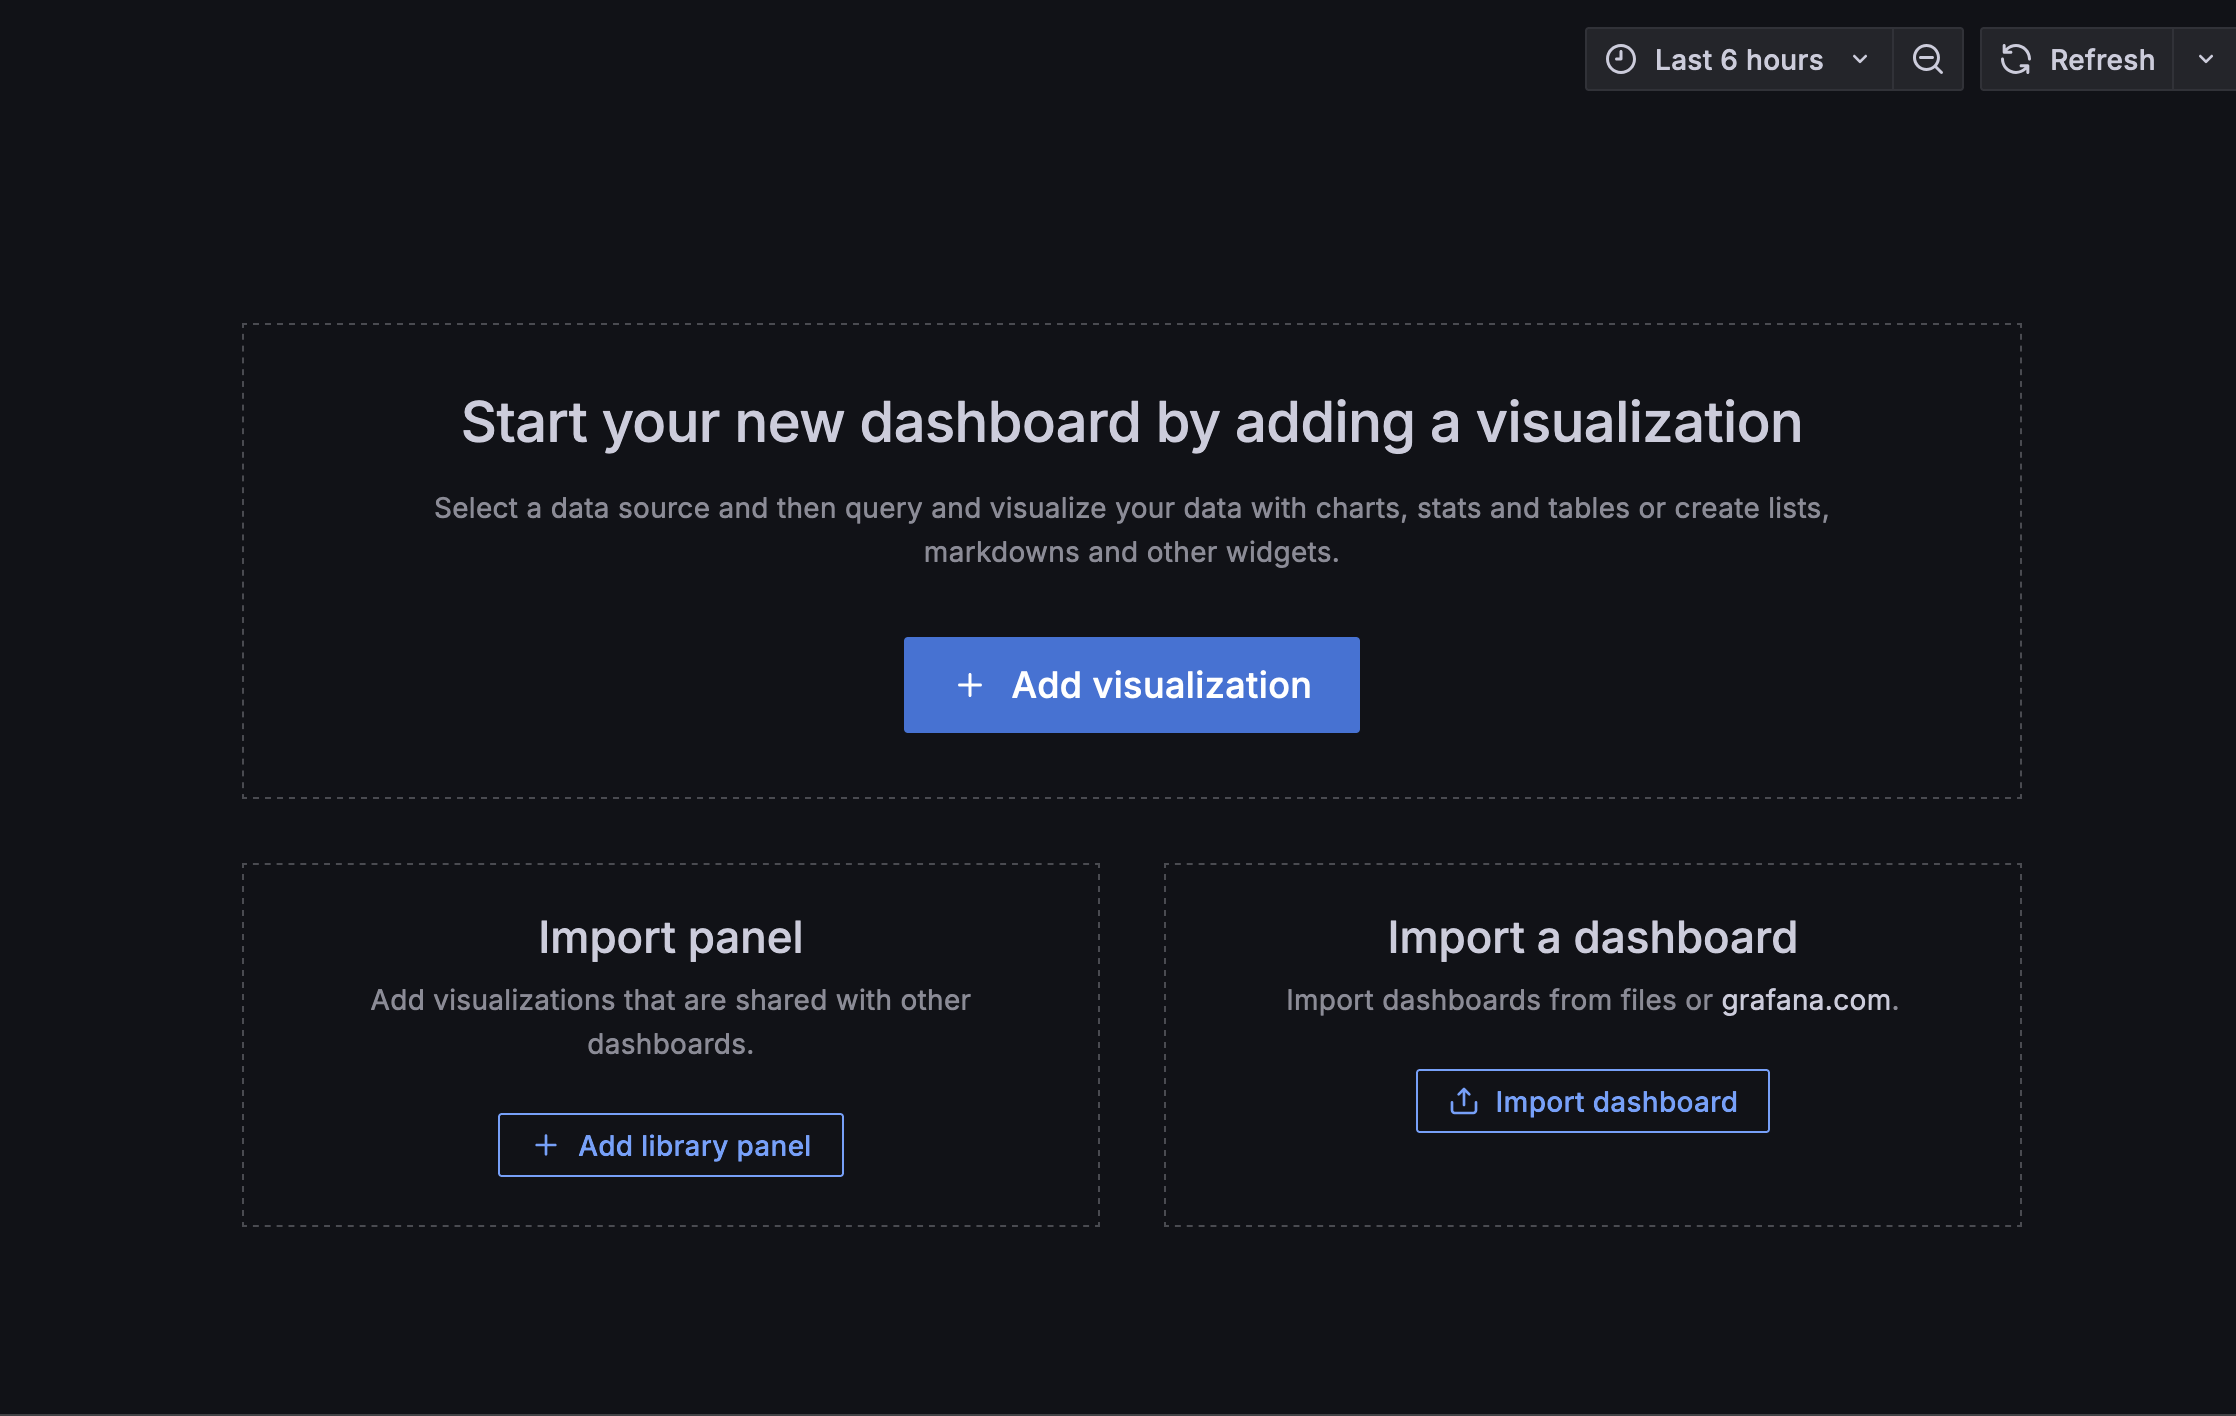
Click in “dasboards” in the left menu, and in the right click in “New” > “New Dashboard”. There click in “+ Add Visualization”
There, select the datasource “prometheus”. Next step is create the query and to do that we must now. What do we want to show in the graph?. The objective is see when happens a new request to the server.
Soo, if the query of the dashboard only is done by “simple_ping_request_done” the result will be the value of the TOTAL requests in a given time and that isn’t what we want, how we can solve this?; Using the funcion “increment” that by the docs do:
calculates the increase in the time series
And that is we want, when the counter change imply a new request!
Soo in Grafana the configuration of the query will be like:
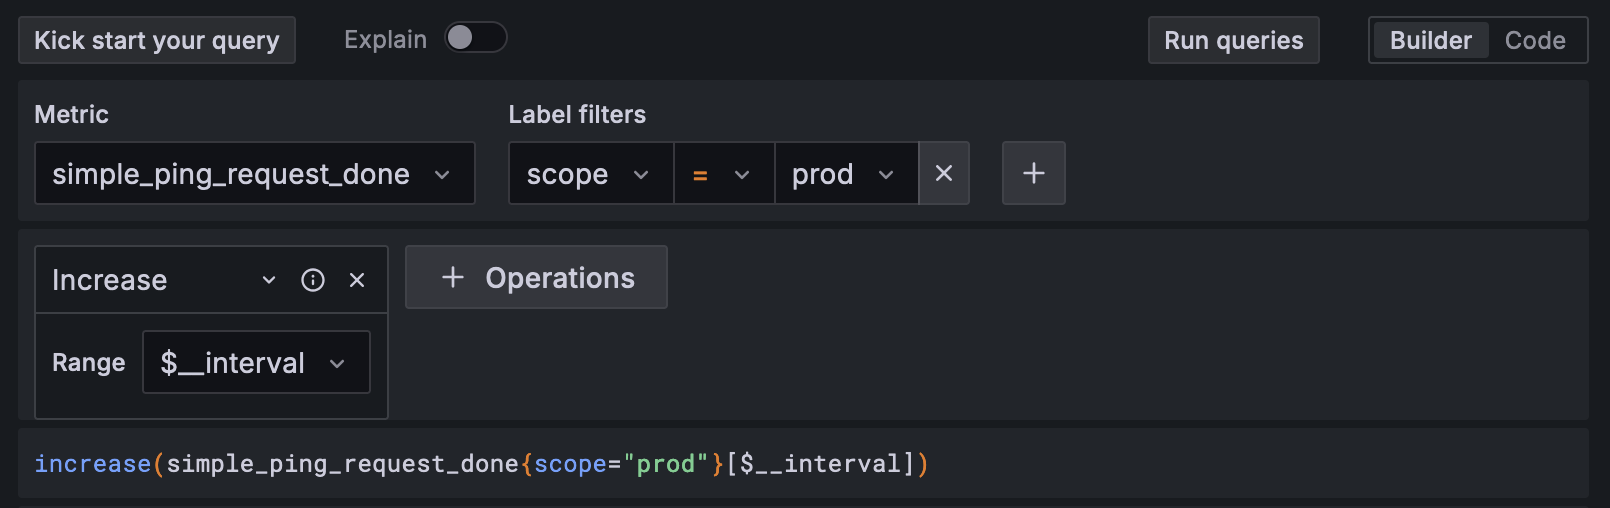
Click in “run query”, “save dashboard” and the visualization is finished (if you want you can do presentation changes for a better look)!
Share the dashboard to the public, when someone do a ping to the API, a +1 will be showed in Grafana
The dashboard created for the API is there: Grafana Dashboard
Getting traffic
If you check the dashboard you will see traffic (little but there is). Where it comes from? From people that try the ping endpoint rightfully and from bots (not mine) that scrape internet checking the health of the network or bots that scrape internet finding vulnerable servers. But that is something to talk in a next post. This post is actually bigger to add more things :p
If you want to test the dashboard it’s simple! Go ahead, you only need to:
- Make a request to https://health.santiagorincon.dev/ping
- Wait 30-40 seconds
- Enter in Grafana Dashboard you will se a +1!